Maximizing ROI with the Right BI Platform
Real business intelligence return on investment (BI ROI) happens when BI platforms speed up decision-making, connect teams to trusted data, and scale without complexity. This article delivers a practical framework for evaluating BI platforms based on business outcomes, implementing them effectively, and sustaining long-term value. It also highlights how Slingshot helps leaders turn data into a consistent driver of revenue, agility, and competitive advantage.
Executive Summary:
Real business intelligence return on investment (BI ROI) happens when BI platforms speed up decision-making, connect teams to trusted data, and scale without complexity. This article delivers a practical framework for evaluating BI platforms based on business outcomes, implementing them effectively, and sustaining long-term value. It also highlights how Slingshot helps leaders turn data into a consistent driver of revenue, agility, and competitive advantage.
Key Takeaways:
- BI ROI goes beyond savings: The value lies in faster decisions, revenue growth, and higher retention.
- Adoption drives value: A tool only works if your teams use it, not just deploy it.
- Unified data makes insights useful: One source of truth increases accuracy and trust.
- A clear framework delivers returns: From setting goals to measuring impact, process matters.
- Sustained results need ownership: Governance, training, and focused dashboards keep BI aligned with business goals.
- Slingshot delivers results: All-in-one hub with natural-language queries, AI trained on your business, and pricing that scales with you.
BI platforms deliver ROI when they enable leaders to make faster decisions, reduce inefficiencies, and provide teams with access to trusted data. Most BI tools fail to do that.
This is why you still wait on reports, rather than having them instantly. They still need three tools, five people, and a half-day of Slack messages. Dashboards go unused. Data lives in silos, and the ROI you expected is still waiting.
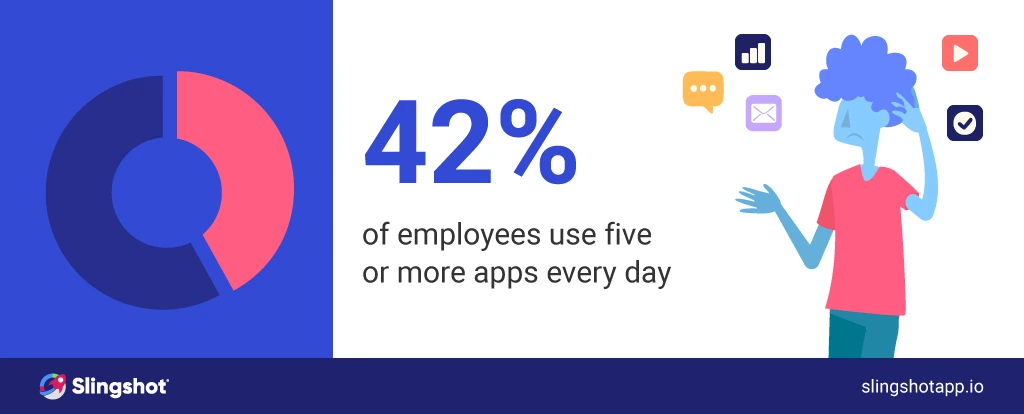
According to the 2024 Digital Work Trends Report, 42% of employees use five or more apps daily. That overload scatters critical data and slows down decision-making.

You invested in BI to speed up execution and tie decisions to business outcomes. But without adoption, integration, and alignment with your strategy, the return stays out of reach.
This article delivers a clear framework for evaluating BI platforms, implementing them effectively, and tracking measurable results. You’ll learn what drives business intelligence return on investment and how Slingshot helps teams turn data into action.
Understanding ROI in BI: Beyond Cost Savings
When most companies talk about BI ROI, they focus on the wrong numbers, such as license costs, report automation, or hours saved. They matter, but they only tell part of the story. The real value of BI shows up when teams make faster, smarter decisions that directly move revenue, retention, and profit.
Cibao Meat Products saw this firsthand. After connecting their accounts receivable data to Slingshot’s live dashboards, their finance team was able to identify payment issues and take action earlier. That shift added $40,000 in weekly cash flow, all from being able to access and act on key metrics faster.
Think of BI ROI in three dimensions:
| Factor | Impact on ROI | Example Metric |
|---|---|---|
| Data Accuracy | Reduces costly errors, up to 30% | Fewer billing or forecast mistakes |
| User Adoption | Doubles efficiency of reporting | Shorter reporting cycles |
| Scalability | Enables growth without rework | Faster pivots to new opportunities |
When you measure BI ROI this way, you stop treating analytics as a reporting expense and start seeing it as a growth engine. The right platform doesn’t just save time. It multiplies the impact of every decision your business makes.
To get that kind of ROI, you need to choose a BI platform that’s built for outcomes, not just output.
Key Criteria for Choosing the Right BI Platform
Choosing the right BI platform isn’t just about feature checklists. It’s about finding a system that people actually use, integrates with the tools you already rely on, and scales with your business. To see real BI ROI, focus on five core areas: Ease of Use & Adoption, Integration & Scalability, Advanced Analytics, Security & Governance, and Cost Structure. These pillars shape how quickly your teams get value, and whether that value grows over time or disappears.
Ease of Use & Adoption
A powerful BI platform only creates value if people use it and trust what they see. One of the biggest barriers to BI ROI is adoption. If your platform is hard to navigate, teams will avoid it. They’ll keep relying on spreadsheets or chasing someone in data ops to run reports.
Look for platforms that offer:
- Drag-and-drop dashboards that require no technical training
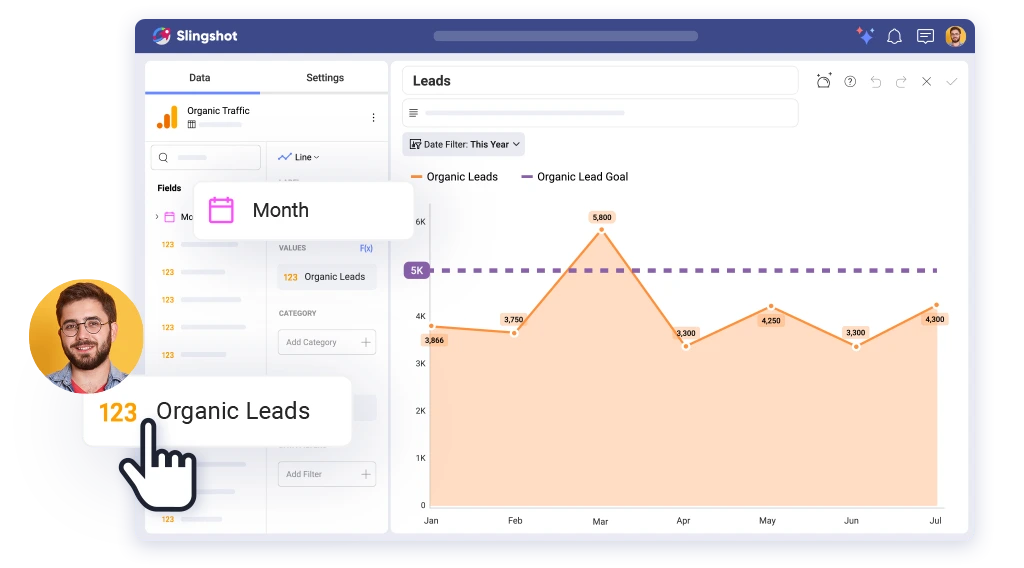
- Natural language queries so anyone can ask questions and get answers
- A clean, mobile-friendly design that works for busy teams
- Simple filtering and sharing to avoid bottlenecks
To evaluate adoption, measure:
- The percentage of users building dashboards on their own
- Monthly active users compared to total licenses
- How long does it take a new user to create or view a meaningful report
Ease of use builds trust and speeds up access to insights. The more teams rely on the platform to make decisions, the faster you see real return.

Integration & Scalability
Even the best analytics platform fails if it can’t connect to your data. When teams have to pull numbers manually or switch between apps, the value of BI disappears. Integration is what turns business intelligence from a reporting tool into a daily operating system.
Look for platforms that connect to:
- CRMs, ERPs, and marketing automation tools
- Cloud data warehouses and spreadsheets
- Apps your teams already use every day
Strong integration means less manual work, faster access to insights, and more trust in the data.
Scalability matters just as much. As your organization grows, the platform needs to support more users, more data, and more complexity without friction. That includes:
- Flexible data models that handle growth
- Multi-team environments with permission controls
- Role-based access so users only see what’s relevant
A BI platform that integrates quickly and scales easily supports long-term ROI. It gives teams the data they need without slowing down or adding overhead.
Advanced Analytics
BI isn’t just about looking back. The most valuable platforms help teams predict what’s coming and act before problems grow. Without advanced analytics, BI becomes a static reporting tool that tells you what happened, but never what to do next.
Look for features that support forward-looking decision-making, such as:
- Forecasting and predictive models that highlight trends early
- AI and machine learning that flag anomalies automatically
- What-if scenario tools that help teams compare options
- Smart recommendations that guide next steps
These capabilities move BI from passive insight to active decision support. They reduce the risk of missed opportunities and give teams a faster path to action.
As your business changes, analytics should evolve with it. A platform that delivers more than charts and dashboards becomes a critical part of your decision-making process. That’s what drives BI ROI over time.

Security & Governance
Business intelligence platforms handle sensitive data. Without strong security and governance, you risk compliance failures, misinformed decisions, and breakdowns in trust. Teams won’t rely on insights if they don’t trust the source, or if they see different numbers in every report.
Security starts with core controls:
- Role-based access to protect sensitive data
- Single sign-on, two-factor authentication, and audit logging
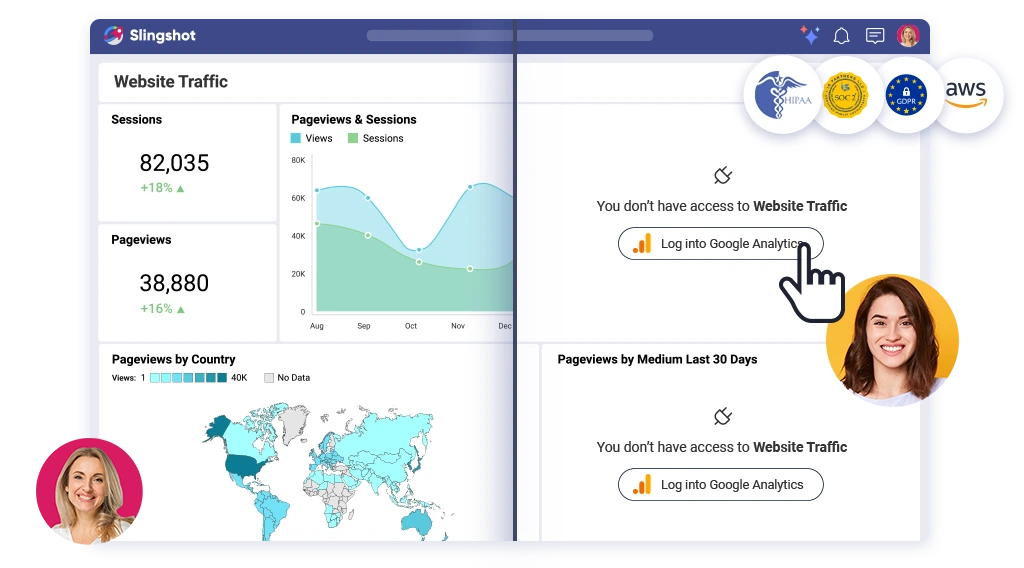
- Compliance with standards like GDPR, HIPAA, and SOC 2
Governance is what keeps your data consistent and usable across the organization. That means:
- Standardized definitions for KPIs
- Version control for dashboards and reports
- Approval workflows to manage what gets shared
Together, security and governance create a single source of truth. They reduce risk, improve data quality, and make sure everyone is working from the same playbook. This is essential for long-term business intelligence ROI.

Cost Structure
Pricing can make or break the long-term ROI of a BI platform. A tool might look affordable upfront, but it becomes expensive once you factor in training, maintenance, or usage-based fees. Cost shouldn’t be measured by licenses alone. It should reflect the total effort required to get value from the system.
Look closely at:
- Pricing models, whether per user, per workspace, or based on data volume
- Data limits, including charges for storage, refreshes, or row counts
- Total cost of ownership, including onboarding, support, and consulting needs
A platform with transparent pricing and low overhead frees your team to focus on insights, not admin work. The right setup saves time, scales efficiently, and reduces the hidden costs that erode BI ROI.
Smart buyers treat BI like a long-term investment. The true cost is not what you pay, but what you get out of it.
When you focus on these five pillars, you’ll be in a strong position to choose a platform that drives clear, measurable BI ROI.
A Step-by-Step ROI Framework for BI Implementation
Strong BI ROI depends on more than buying a tool. You need a structured plan that aligns data with business goals and promotes adoption. This roadmap shows how to turn BI investments into a measurable business intelligence return on investment.
1. Define the Business Problem
Start with clear goals, such as reducing churn or improving forecast accuracy. Companies that apply data strategically report 51% stronger customer retention, proving that clarity at this stage drives outcomes.
2. Evaluate Vendors
Test two or three platforms with real data. Focus on usability and adoption, not feature checklists. This helps predict long-term BI ROI more accurately.
3. Pilot & Train
Run pilots with cross-functional teams. Develop internal “BI champions” who encourage colleagues and sustain usage. Adoption is the bridge between tools and tangible business intelligence ROI.
4. Integrate & Scale
Automate data pipelines and reporting workflows. Integrate across CRMs, ERPs, and marketing tools to avoid silos. Scalability is key to maximizing BI ROI over time.
5. Measure & Optimize
Track adoption rates, reporting efficiency, and business outcomes. Use these metrics to refine processes. Continuous measurement turns BI into an ongoing business intelligence return on investment rather than a one-time gain.
A clear framework ensures your BI rollout delivers early wins, but sustaining results requires long-term focus. The next step is to look at strategies that maximize ROI over time.
Strategies to Maximize ROI Long-Term
The value of BI doesn’t fade overnight. It erodes quietly. A few outdated metrics, a dashboard no one opens, a team making decisions by instinct instead of insight. That’s how ROI slips.
To prevent this, BI needs to become an integral part of how the business operates. Not something you launch, but something you maintain. There are a few strategies that keep your platform relevant, your data trusted, and your teams engaged, long after the initial rollout.
1. Align BI with Business Goals
Dashboards should mirror your strategic KPIs. Tie every chart to a decision. Document owners and refresh cadence.
- Map each metric to a business question.
- Add targets and thresholds next to trends.
- Use this guide to operationalize data insights.
This focus keeps BI ROI visible to leadership and teams.
2. Improve Data Governance
Create a single source of truth with clear ownership. Standardize naming, definitions, and access.
- Set data stewards for core domains.
- Publish metric definitions and change logs.
- Audit permissions and logging quarterly.
Good governance protects business intelligence return on investment and reduces rework.
3. Encourage Adoption
Make BI easy to learn and rewarding to use. Recruit champions in each function.
- Start with ready-made Templates for faster onboarding.
- Run short role-based trainings and office hours.
- Recognize teams that use insights to ship improvements.
Higher usage boosts business intelligence ROI across departments.
4. Optimize Dashboards
Design for decisions, not decoration. Prioritize high-impact views and reduce clutter.
- Use productized dashboard software for consistent UX.
- Pair dashboards with on-page Data Analysis to answer follow-up questions.
- Limit widgets to what leaders act on weekly.
A cleaner experience increases BI platform ROI and speeds adoption.
5. Continuously Evaluate Performance
Review outcomes on a schedule. Track the drivers that move results.
- Measure time saved, revenue impact, and error rates.
- Compare adoption by team and role.
- Rebuild low-value dashboards each quarter.
Data-driven companies report faster revenue growth and higher profits, which reinforces sustained ROI.
These habits turn BI into a flywheel. They protect BI ROI and expand business intelligence return on investment as your data and teams grow.
Turning BI ROI into Sustainable Growth
Business intelligence doesn’t stand still. The decisions you make today will shape how flexible and useful your data remains a year from now. Teams that treat BI as infrastructure, not a reporting tool, are the ones that see long-term gains. They build workflows around insights. They invest in tools their teams actually use. And as their strategy evolves, so does the way they use data.
Looking ahead, AI will push this even further. BI platforms that combine predictive models with natural language queries will shorten decision cycles and expand access to insights. This shift will enhance business intelligence ROI by enabling leaders to anticipate challenges and take action before issues escalate.
When reviewing tools, start with a clear framework and compare them against trusted resources, such as the Best business intelligence tools for startups. Then ask how each option supports execution, adoption, and scalability.
Why Slingshot delivers lasting ROI:

- All-in-one hub: Combines project management, chat, content sharing, and dashboards in one place.
- Simplicity that scales: Easy for small teams to adopt, yet powerful enough for enterprises.
- Unified data and work management: Keeps projects, files, and analytics together in one source of truth.
- Custom fields built-in: Advanced options without extra setup or hidden upgrades.
- Analytics for everyone: Integrated analytics with no add-ons or premium tiers required.
- AI trained on your business: Context-aware recommendations that adapt to your workflows.
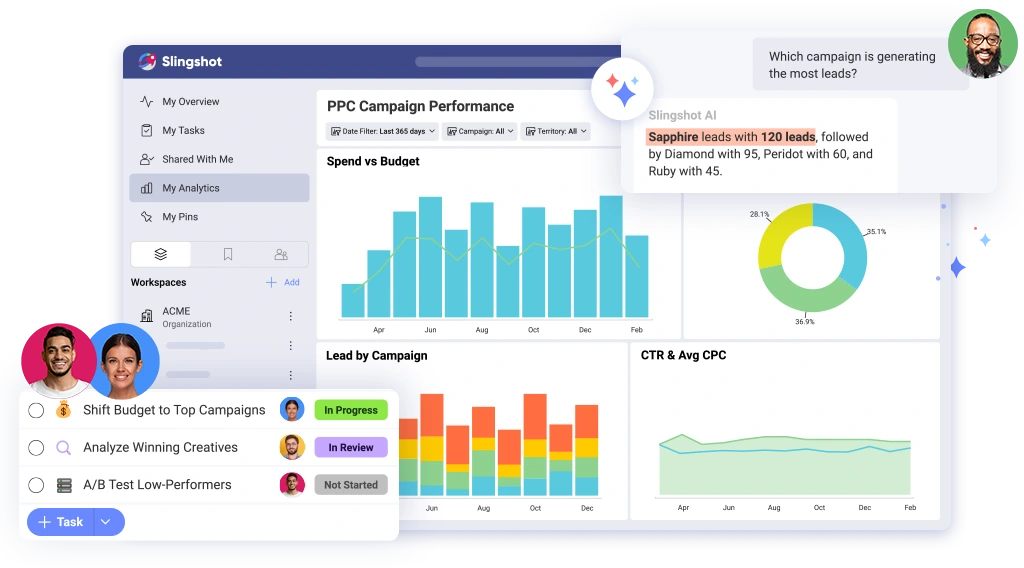
- Natural-language queries: Ask questions in plain language and get insights instantly.
- Flexible security: Role-based permissions that scale with your business.
- Transparent pricing: No hidden add-ons, clear value as your team grows.
Slingshot combines collaboration, analytics, and AI in a single platform. This all-in-one approach helps organizations capture lasting BI platform ROI and turns BI into a sustainable driver of growth.
Ready to grow your business 10x with AI decision-making?
Request a Free Demo of SlingshotSHARE THIS POST


 Return to Blog
