

Top KPIs to Include in Your CMO Dashboards to Get Great Results
Your CMO dashboards show you what works and where you should put more effort, while helping you speak the language of data. So what insights should be included in them, in the sea of possibilities an data points? We tell you in this article.
Executive Summary:
Your CMO dashboards show you what works and where you should put more effort, while helping you speak the language of data. So what insights should be included in them, in the sea of possibilities an data points? We tell you in this article.
The potential well-built CMO dashboards bring to boosting your business results is astounding. It provides every marketer with the comfort of knowing what’s working and guides them toward a brighter future. A CMO dashboard is the most direct visual connection you could possibly have between a marketing campaign and the results you’re getting. After all, it’s all about causality and reasoning.
But how can you make sure you use your CMO dashboard in the best way? How can you know which KPIs to track and to make sure you understand them in a way that helps you speak the language of data that will lead you to better pastures in every strategy?
What is a CMO Dashboard
A CMO dashboard summarizes all the important key performance indicators (KPIs) and metrics across multiple marketing channels and visualizes them so they can be consumed in one view. These KPIs are displayed in an easy-to-grasp way so that CMOs can identify quickly and efficiently the ups and downs of a campaign’s execution, for example.
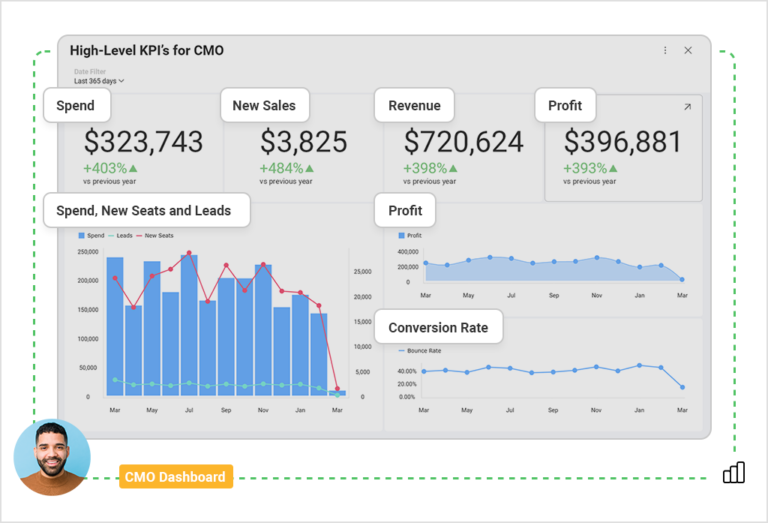
Dashboards should always tell a story – so that any viewer can gain fast insights. A CMO dashboard needs to present the metrics that are tied to the marketing effort and the revenue it generates.
At the same time, it should help with:
- A cross-department balance between Sales and Marketing and alignment in their goals
- Setting expectations around lead scoring and attribution
- Setting targets and future investments for longer-term plans
- Clearly showing the team’s effort and performance
- Showing real-time insights that set a roadmap for the future
- Display useful patterns and trends
Above all else, a CMO dashboard makes the excruciation effort of staring at a spreadsheet to understand data a thing of the past. To explore why that is so important, keep reading below.
Why Use a CMO Dashboard
Data matters – now more than ever. And we have it in large quantities than we ever have before. It’s easy to accumulate it and marketers all over the world do just that – grab it from so many platforms, social media sites, and whatnot. But all of this collected data means nothing if it’s not segmented and analyzed to show the big picture.
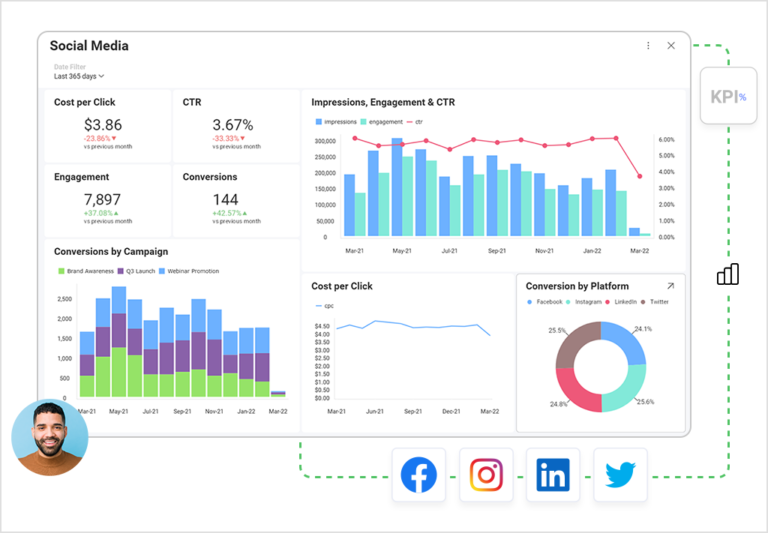
This is precisely what a CMO dashboard does – it lets a marketing executive into the big picture of what’s happening within one glance. In a CMO dashboard, data is combined and presented through the KPIs important to your team.
You need to use a CMO dashboard if:
- You regularly accumulate data from multiple sources and need to know from a high level how your campaigns are performing
- You need to see what’s working now and what has the potential to work in the future – in a glance
- You need to be able to save time and breeze through the displayed data, understand it in seconds, and take action
- You need a good compass for future strategies you will craft
The data displayed in your CMO dashboard is also the secret weapon for managers who need to make a good pitch in front of investors, check out the numbers quickly, and overall, become more fluent in data. It’s the quickest way to maintain a good handle on things, check out comparisons, and see priorities, as well as keep up with your team’s efforts and performance.
Benefits of a CMO Dashboard
For every CMO, using a CMO dashboard is a great way to save time, save money and drive revenue growth in less time than they (and the organization) otherwise would. It eliminates the need to collect and process data that is pulled from a lot of different sources, making it highly accessible.
According to one report, 89% of marketers have problems in creating a single view of data with cross-channel marketing when having to correlate data from different channels. In the long run, this could really become a crisis point – make it harder to create a new and better strategy, for one. So, what are the most important benefits of a CMO dashboard?
Build Data-Driven Marketing
Embracing data-driven approaches in your marketing strategy means getting in front of the competition, completing your objectives faster and with specific steps in mind. A CMO dashboard is at the core of any chief marketing officer’s superpowers – it doesn’t only show you the data, it points you in the direction of what to do next in regard to it.
Across All Platforms
A CMO dashboard is the perfect way to gather data across all platforms, visualize it, correlate it, find the patterns, and compare the metrics quickly. And since in most marketing teams, efforts are spread across multiple channels, having a way to compare all the data in one glance brings an entirely new meaning to time efficiency.
KPIs Have Never Looked Better
Your marketing strategy is closely tied to different KPIs you need to observe and achieve. With a CMO dashboard, you can check out the collection of all your KPIs in a beautiful way, find out where you stand in terms of budget and where to double the effort while seeing your weaknesses.
No More Mistakes
A CMO dashboard is showing you the way to data-driven decision-making, eliminating the potential for mistakes you would make without those insights. It’s time to focus on more than just that “gut feeling” – and use the right tools to show you the way.
Next Level Comprehension
What every CMO essentially wants is having the ability to dig deeper within metrics, KPIs, and find all the answers to questions about campaigns and customers, channels, key marketing metrics, etc. A CMO dashboard provides that deep dive by bringing all the answers in one place.
Top KPIs you Should Include in Your CMO Dashboards
It’s time to look at the most relevant KPIs that should be included in your CMO dashboards, to gain the most out of your decision-making. But we can’t do that unless first, we look at what are every CMO’s priorities that a CMO dashboard can help with. First, there are the weekly team meetings, requiring the close observation of priorities and setting the tone for the next steps. Second, every CMO is an integral part of monthly meetings with high-level meetings with the board or with investors, discussing the overview of marketing KPIs and the contribution of marketing to the overall results and revenue.
Because of these requirements, a CMO dashboard should always contain:
- A clean and easy to understand overview of the marketing performance
- A timeframe of the reports presented
- An easy way to grasp a comparison of the data (e.g., year to date vs. last week, month, or a custom date range, while looking at a before/after the campaign)
High-Level KPIs for a CMO Dashboard
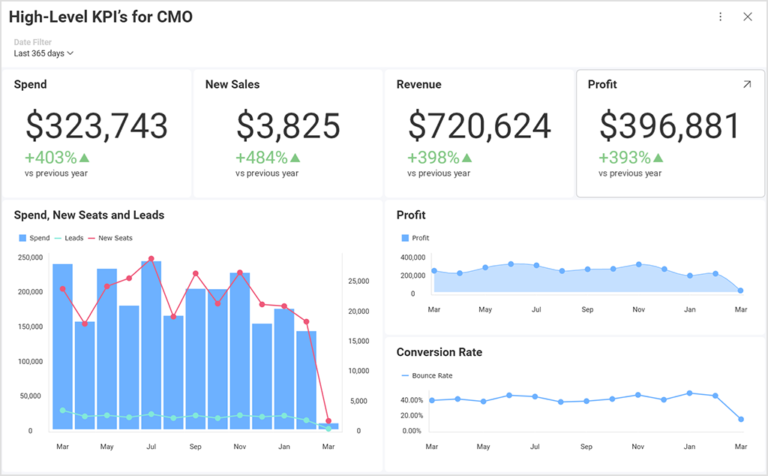
Among the KPIs a high-level CMO dashboard should have are:
- Sales/Leads
- Cost
- Revenue
- Profit
- Conversion rate
By including these metrics, a CMO can demonstrate how budgets are being spent and which channels are yielding the best results. It also helps to show how their strategy is evolving and see the trends that must not be neglected. Through those high-level metrics, a CMO is also able to help in defusing potential problems before they escalate.
Marketing Channels Performance
Besides the high-level KPIs, a CMO dashboard is a great way to display your marketing channel’s performance where data is being accumulated daily and weekly. It’s important to show the channels that are being used regularly and display the execution of any campaign that is happening or has already been completed. In delivering the channels where a brand is most active in visualization, a CMO dashboard can show where the impact is biggest and where the team should put more effort in.
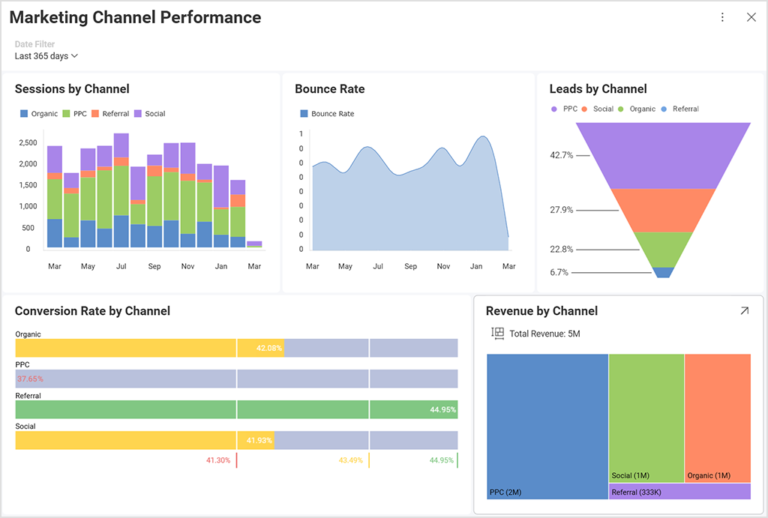
The good news is that a CMO can make as many dashboards as needed, to show important marketing KPIs like:
- Paid search/paid social – clicks, cost, sales/leads,
- Conversion rate, ROAS (Return on Ad spend, Return on investments)
- Organic search/organic social sessions
- Sales, Revenue, the conversion rate in different channels
- Email – sessions, CVR, sales, revenue
- ABM metrics
- Retention – returning customers, lifetime customer value, churned customers
- Best performing ads and brand content across channels (including CTAs, creatives)
- Engagement metrics – CTR, bounce rate, avg. session durations
These are the most important metrics a CMO dashboard should have to really drive results through data points. An intuitive dashboard is also really actionable – through showing the summary of performance, it illustrates the steps forward, motivated by smart observations and data.
Other Metrics that Might be Useful in the CMO Dashboards
Every CMO and marketing team should stay aware of other metrics that demonstrate how their performance can be improved. Those are not necessarily connected to the results and effort, campaigns, and budgets, but have to do with the customer journey at every stage.
To provide visibility on these “sidebar moments” that are still important, several other metrics can and should be included in your CMO dashboard, like:
- Price changes – before/after impact on customers
- Out of stock products
- Competitor activities
- Website changes
The influence of these metrics can be displayed in a CMO dashboard to help the CMO observe the overall development and results in marketing activities for the brand. In displaying the data shifts and analyzing all of this, the big picture of significant company movements is more easily seen. It can also help with planning and building a better performance plan, assigning specific steps to your team members, and addressing weak spots.
How to Build a CMO Dashboard with Slingshot
Slingshot is an all-in-one digital workplace that focuses on data-driven decision-making with a strong organizational element for teams, data, and content. Through dashboard building, Slingshot provides an easy way for KPI and OKR tracking and offers easily shareable and beautiful visualizations of your data.
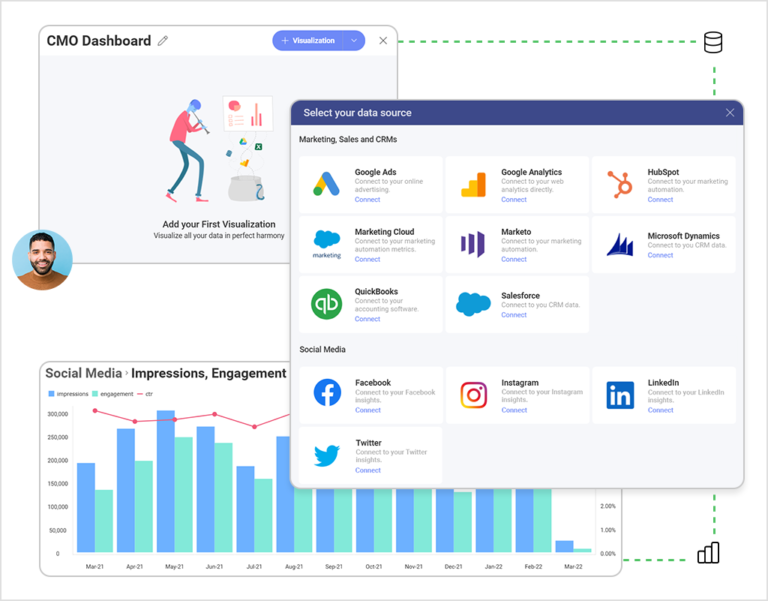
With Slingshot:
- You can quickly connect to your different data sources and create beautiful dashboards within minutes.
- All your files, assets, docs and metrics in dashboards are kept in the same place where collaboration happens
- Slingshot is fully integrated with Azure Machine Learning Studio in Analytics so you can choose your data source, build visualization, and connect to a trained machine learning model
- Slingshot supports Google BigQuery, adding significant speed in processing big data with advanced analytics, allowing for usage of huge datasets in seconds
- Creating different types of dashboards and visualizations of data is easier than ever – with just a few clicks, with many options to edit, a huge load of chart types, filters, and options to save and share your dashboards with internal and external team members
Thanks to its abilities, Slingshot is an invaluable tool for managers who want to stay on top of tracking their work and KPIs, follow the right objectives, and set the tone for the future.
Related Articles
Ready to grow your business 10x with AI decision-making?
Request a Free Demo of SlingshotSHARE THIS POST


