
Operational Analytics for Marketing Teams: Connecting Work and Data in Real Time
Marketing teams need current insight to guide daily decisions, yet scattered tools and slow reporting make this hard to achieve. Operational analytics solves this by showing work and performance in one place, giving teams a live view of pacing, spending, workload, and channel changes. Automatic updates replace manual reporting, which speeds up reactions and improves accuracy. AI and Natural Language data search help teams find answers faster and reduce the effort required for analysis. Slingshot enables this approach with a unified workspace that matches the speed and complexity of modern marketing work.
Executive Summary:
Marketing teams need current insight to guide daily decisions, yet scattered tools and slow reporting make this hard to achieve. Operational analytics solves this by showing work and performance in one place, giving teams a live view of pacing, spending, workload, and channel changes. Automatic updates replace manual reporting, which speeds up reactions and improves accuracy. AI and Natural Language data search help teams find answers faster and reduce the effort required for analysis. Slingshot enables this approach with a unified workspace that matches the speed and complexity of modern marketing work.
Key Takeaways:
- Operational analytics improves campaign pacing by giving leaders early signals about bottlenecks, workload pressure, and shifts in performance.
- Teams plan and prioritize better when task structures, timelines, and goals follow consistent frameworks that support clear execution.
- Real-time visibility strengthens channel and budget allocation because decisions rely on what is happening now, not on delayed reports.
- Marketing leaders gain clearer ownership across roles when work and data follow the same structure and update in the same space.
- AI features and Natural Language data search reduce analysis time and help teams focus on actions that improve results.
- A unified operational workspace reduces friction across campaigns, giving teams a more predictable, stable, and scalable way to deliver marketing work.
Marketing teams often feel the strain of having their work scattered across multiple platforms. You switch tools to track tasks, check results, and prepare reports. None of it sits in one place. Numbers shift before you finish your update. This creates a real gap between work and performance insight.
Teams miss early signals that protect spend and guide pacing. Common issues include budgets that move after the impact, campaigns that drift from targets, uneven workloads across teams, and trends that appear too late to fix.
Operational analytics solves this problem:
- It connects your work and your data
- It gives you a clear view of progress and risk
- It supports decisions during the work, not after it
Why It Matters Now
The rhythm of marketing work keeps accelerating. Campaign activity shifts within hours, yet many teams still work with reporting cycles built for slower environments. This gap grows each quarter as channels multiply and expectations rise.
Marketing teams now face new timing pressure:
- A channel can peak before lunch and drop by the afternoon
- Budgets move faster than planned
- Leaders expect updates that reflect the current state of performance, not last week’s results
- Review cycles accelerate even as team capacity stays the same
- Client expectations shift as soon as new data appears
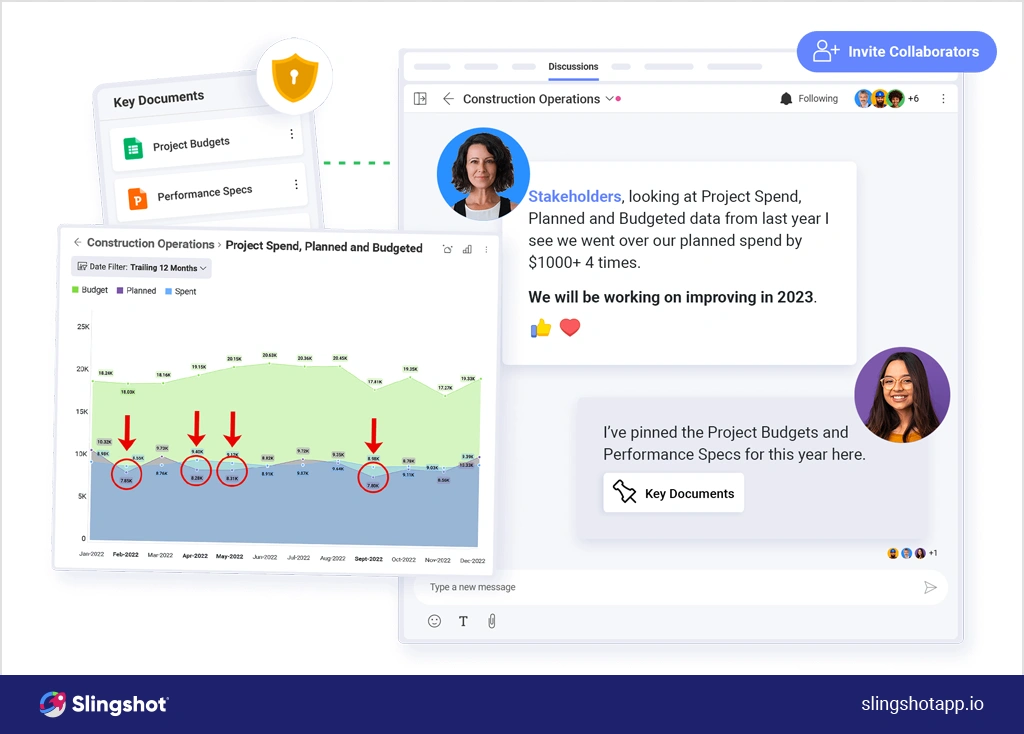
Marketing leaders now need real-time clarity to adjust high-value decisions like:
- Performance trends that shift within a single day
- Spend patterns that shape weekly results
- Resource needs across parallel campaigns
- Cross-channel behavior that affects the pipeline
- Creative performance signals that guide asset priorities
- Pacing shifts that influence daily channel allocation
Most teams check performance through dashboard software that updates at a different rhythm than their daily work. Project tools move at the pace of tasks, but they do not show how performance changes during execution. This split view forces teams to work with partial information.
What Is Operational Analytics?
Most teams want to use data in their daily work, but they rarely get it in a form that helps them act. Reports give a summary. Dashboards give trends. Neither one explains how work and results connect while campaigns run. This is why operational analytics has gained so much attention in marketing teams.
Operational analytics unifies the massive load of information marketing teams need to consider before acting in a single source of truth. More importantly, this happens precisely where they work. Currently, nearly half of employees and leaders use five or more workplace applications per day, with 12% saying they use seven or more.
Operational analytics uses real-time data analysis to connect daily activity with performance signals in one place. This helps teams adjust plans while campaigns move, not after results settle.
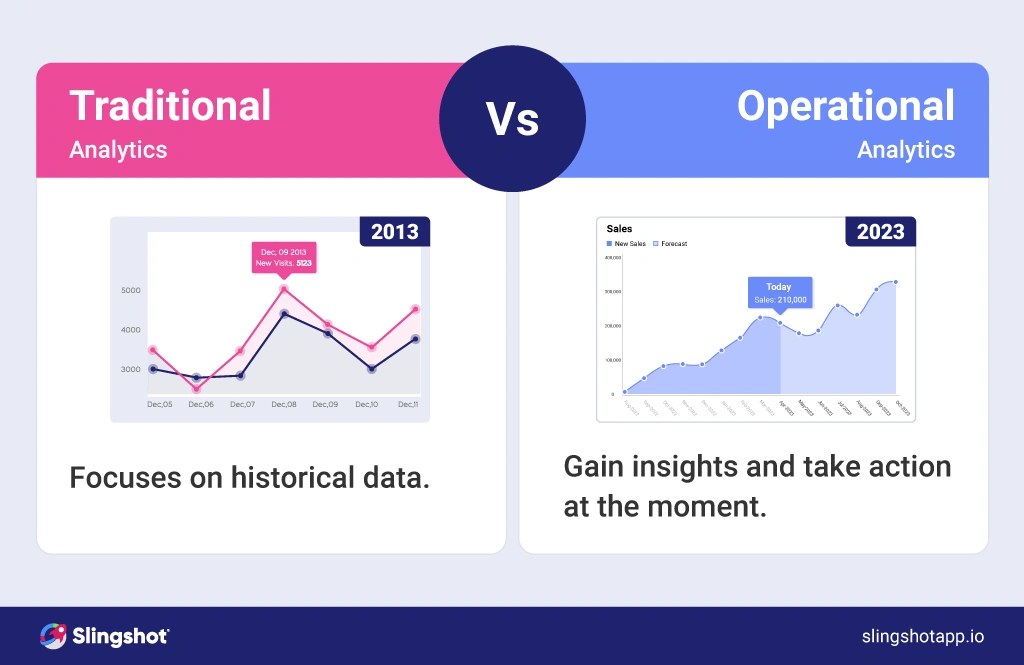
This shift reflects a broader trend in how teams use data. Today, 81 percent of data analytics users rely on embedded analytics. They want insight into the tools they already use. They want clarity without switching between 5-7 systems and platforms. They want the disconnect between work and vital data to be closed.
The Disconnect Most Teams Live With
When work and data are disconnected, these problems are inevitable.
| Problem | How It Shows Up | Impact on Teams |
|---|---|---|
| Scattered tools | Tasks in one place, KPIs in another | Slow decisions and unclear ownership |
| Manual reporting | Exports, slides, screenshots | Outdated insight and wasted time |
| Data silos | CRM, BI, and channel data stored separately | Partial visibility and late reactions |
| Human bottlenecks | One person “knows where things are” | Delays and high dependency |
| Slow review cycles | Weekly or monthly dashboards | Missed early signals and pacing issues |
These gaps block real-time action. But the solution is already out there, and the shift is happening right now.
The Shift: From Reporting to Real-Time Insight
The traditional reporting model has its place in some industries, but it’s not within fast-paced environments such as modern marketing. As a result, the more forward-thinking marketing agencies already switched to real-time insight models
Here is how the two models differ:
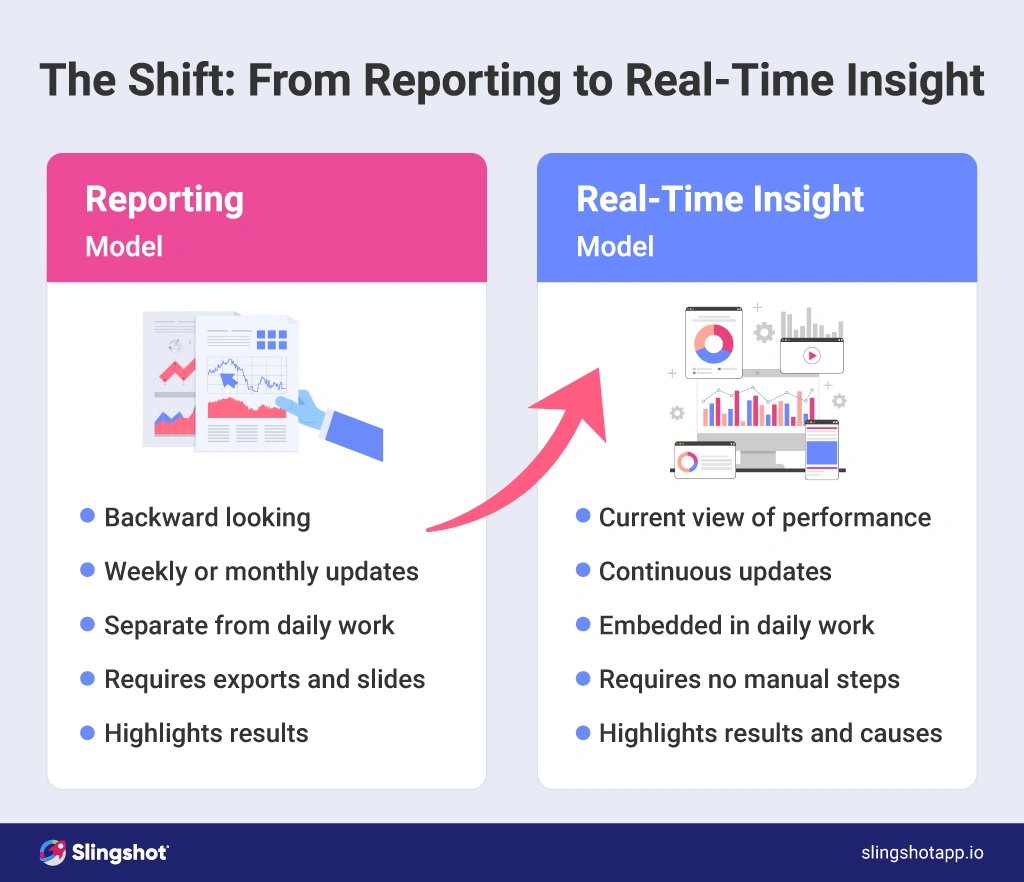
Better timing leads to better outcomes.
How to Bring Operational Analytics to Your Team
Operational analytics works best when marketing teams build a clear structure that ties their work, data, and decision-making into one flow. The goal is simple. You want a system that turns activity into clarity while work moves. So, how do we bring operational analytics to your team in a practical, scalable, and most importantly, adoptable way?
Step 1: Define the Decisions Your Team Makes Every Day
The best operational analytics setups begin with clear decisions.
Your team makes multiple high-value choices during active campaigns, and each one needs timely context.
Marketing leaders often monitor:
- Budget pacing across channels
- Creative production timelines
- Shifts in performance signals
- Cross-channel behavior that shapes the funnel
- Workload pressure during peak periods
- Time-to-launch for high-impact assets
These decisions shape how operational analytics for marketing should work because each question requires live insight, not reports that arrive days later.
Step 2: Align Your Workflows with Clear, Repeatable Structures
Consistency makes operational analytics easier to adopt. Use templates to standardize:
Campaign plans
- Asset production workflows
- Channel-specific task lists
- Launch checklists
- Reporting cycles
These structures make operational analytics more reliable. They tie work to timelines and provide marketing teams with a clear view of how daily actions impact performance.
Step 3: Bring Your Performance Data into the Same Workspace
Bring KPIs, spend data, and channel metrics into the same workspace where you manage campaigns.
This is where platforms like Slingshot deliver results. At MLB, for example, the team saved $8,000 per month by retiring a design agency contract and cut time to insight by 90% when they brought work and data into one workspace.
We turn insights into immediate action – initiating a promotional campaign to drive up lagging numbers.
Travis Rotondo, IT Applications Manager at MBL
Step 4: Automate Updates So Insight Stays Current
Automation keeps operational analytics for marketing teams up to date. Manual reporting creates delays because the information changes before teams have a chance to review it.
Automation syncs for:
- KPI updates from your channels
- Budget pacing feeds
- Asset timelines
- Status changes across teams
- Risk signals during campaigns
These updates prevent teams from working with old data.
Step 5: Give Each Role the Right Level of Visibility
Strong operational analytics supports different needs at each role level. Not everyone works with the same depth of detail, so your views should adjust to each function.
Teams work better when they see insights that match their responsibilities:
- Analysts need detailed performance signals
- Managers need pacing, workload, and risk
- Directors need progress summaries
- Executives need clear context without data digging
A strong setup gives each group the right perspective. This improves confidence in decisions and reduces the guesswork inside your review cycles.
Step 6: What to Look for in an Operational Analytics Tool
The right operational analytics tool should support the full marketing workflow. It should help you understand what is happening now and how the current work affects results.
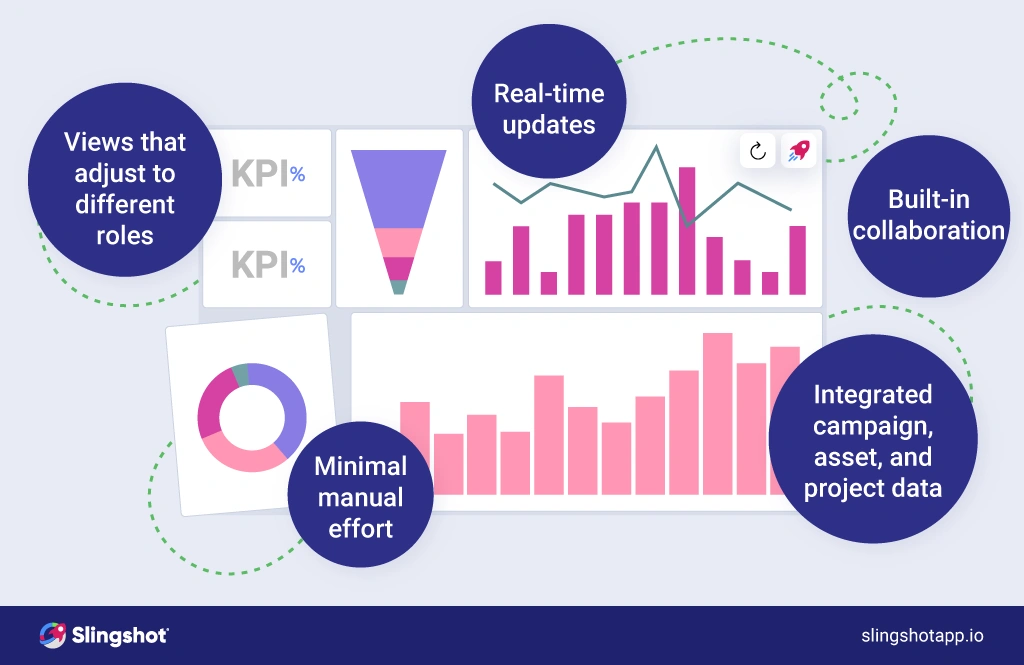
Look for:
- Real-time updates
- Integrated campaign, asset, and project data
- Views that adjust to different roles
- Built-in collaboration
- Workload and capacity insight
- Minimal manual effort
- Clear connections between tasks and performance
- Support for repeatable frameworks like Templates
- Unified cross-channel visibility
- Flexible dashboards that support fast decisions
These capabilities help teams react earlier and understand the full impact of daily work.
Marketing Use Cases That Benefit from Operational Analytics
Operational analytics supports these workflows:
- Cross-channel campaign management
- Creative production pipelines
- Paid media pacing
- Content development workflows
- Product marketing timelines
- Funnel performance checks
- Launch planning and execution
- Marketing-to-Revenue alignment
- Client reporting for agencies
Each use case benefits from connected work and performance signals inside the same workspace.
The Payoff
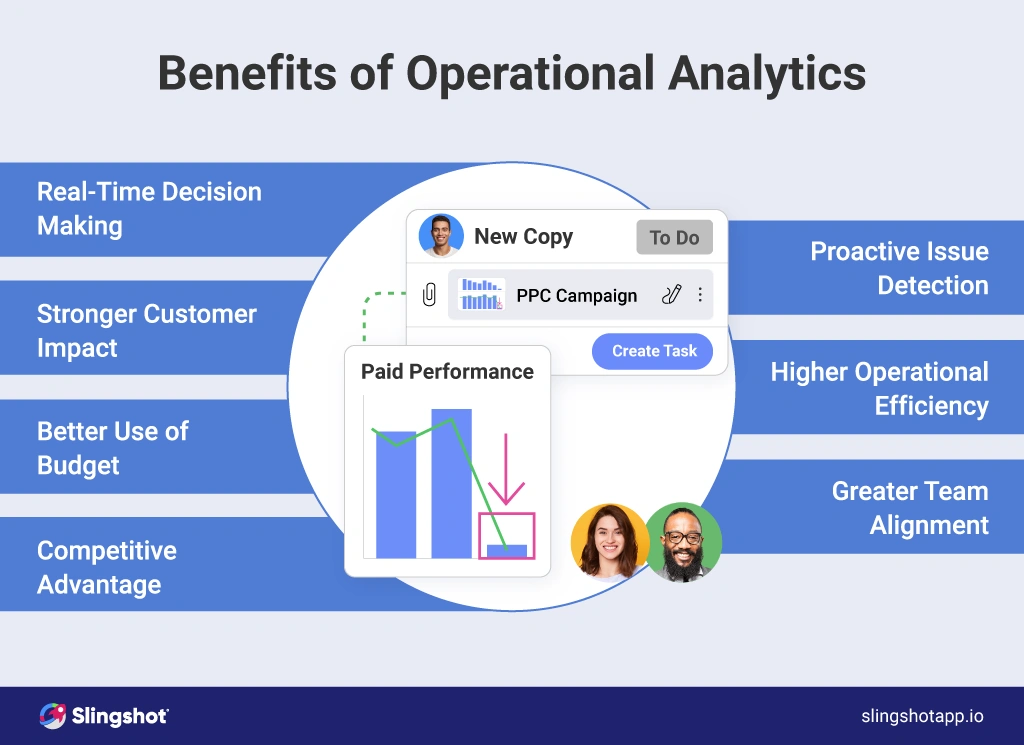
- Real-Time Decision Making
You adjust budgets and assets with confidence. This protects spending and keeps campaigns aligned with your goals.
- Proactive Issue Detection
Teams catch issues early because performance signals update throughout the day. Drops in engagement, slow creative production, and pacing problems become visible before they damage results.
- Stronger Customer Impact
You understand how customers react in real time. This helps you adjust messaging, creative, and channel mix while campaigns run.
- Higher Operational Efficiency
You reduce the time spent on updates and reviews. Workloads stay balanced because you see pressure points early. This supports smoother delivery across teams.
- Better Use of Budget
Marketing teams protect spending when they catch drift early. You shift budgets sooner and gain more value from each channel.
- Greater Team Alignment
Everyone sees the same context. Analysts, managers, and executives work from a shared source of truth. This reduces update requests and shortens approval cycles.
- Competitive Advantage
Teams with operational analytics move faster than teams with static reporting. You act before problems grow and plan with more accuracy. This speed becomes a long-term advantage in crowded markets.
For example, Stephen Gould increased team capacity by 30 percent without hiring by connecting daily work with live insight.
How Slingshot Enables Operational Analytics
Slingshot brings operational analytics into the center of your marketing workflow. It connects your work, your data, and your decisions in one place.
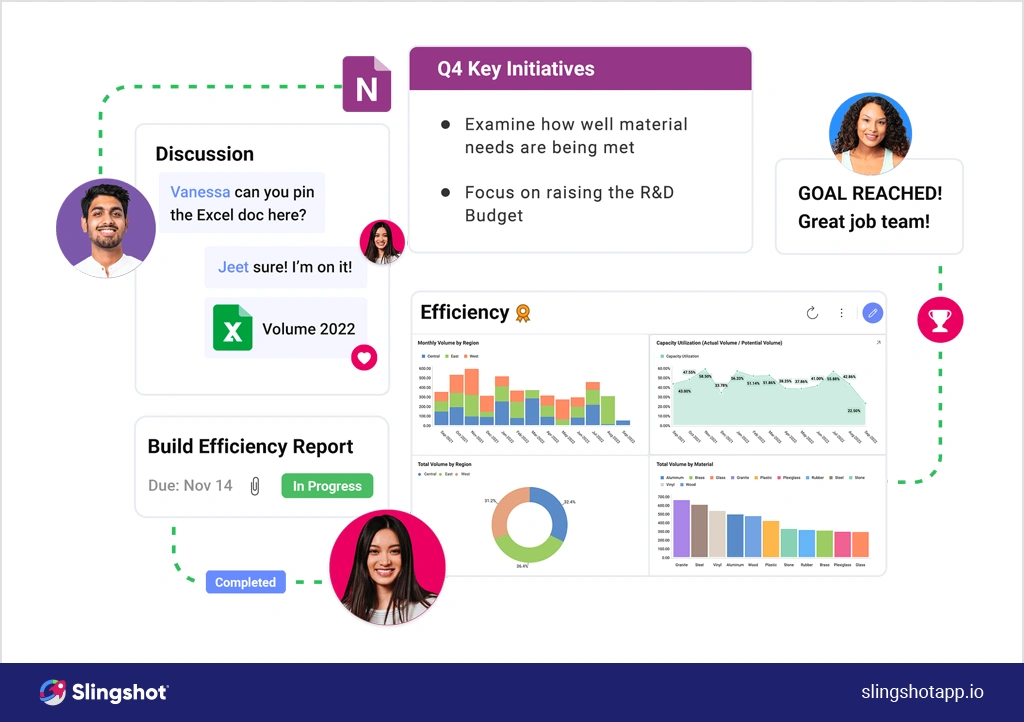
You get features that match the pace of modern work:
- Real-time visibility across campaigns, assets, and deadlines
- Natural Language data search for faster insight
- Centralized task, timeline, and performance views
- Integrated campaign and asset workflows
- Clear workload and capacity indicators
- Automated updates that reduce manual reporting
- Templates that support consistent planning and execution
- AI assistance that helps teams react earlier and plan smarter
- Unified performance and activity data for stronger decisions
Slingshot’s approach brings operational analytics into the rhythm of modern marketing work. It supports quicker decisions, clearer execution, and a connected workflow where teams act on live insight, not lagging reports.
Related Articles
Ready to grow your business 10x with AI decision-making?
Request a Free Demo of SlingshotSHARE THIS POST


 Return to Blog


